
Skip to content
space_utilization
VIRTUAL SENSOR

Space Utilization

The presence and occupancy tool that puts privacy first.
Measure how your spaces are actually used through environmental data, not cameras.

What is space utilization?

Space utilization is the measurement of how much of a building's available space is actually being used over a given period, typically expressed as a percentage of time occupied or share of capacity in use. It helps real estate, workplace, and facility teams understand whether spaces are right-sized for the people using them, and where to reduce cost, expand capacity, or rethink design.
space utilization

Stop reacting. Start optimizing.

Gain complete visibility into your building operations, eliminate budget surprises,
and transition from "firefighting" to high-performance management.
facility_manager_notifications

Built for facility mangers

Save time

→ Get a quick overview of your entire portfolio from anywhere

→ Prioritize worst-performing spaces first

→ Generate compliance reports in minutes, not hours

Stay ahead of problems

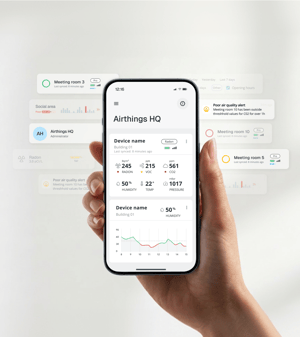
→ Real-time alerts when conditions exceed thresholds

→ Use trend data to predict and prevent issues

→ Fix problems before they become complaints

Seamless integration

→ Connect to your BMS for automated HVAC optimization
→  Receive alerts in Slack, Teams, or email
→  API access for custom dashboards and analytics


Easy to deploy and maintain

→ Fully wireless sensors, no complex cabling
→  Long battery life means minimal maintenance
→ Scale easily as your portfolio grows


IN THE DASHBOARD 

How space utilization works

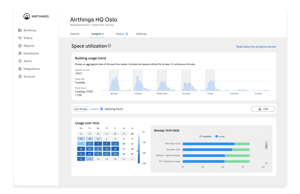
Space Utilization turns presence signals into a clear, real-time picture of how every room and floor is actually being used, visible in the Airthings for Business Dashboard.

users-three
Presence & occupancy
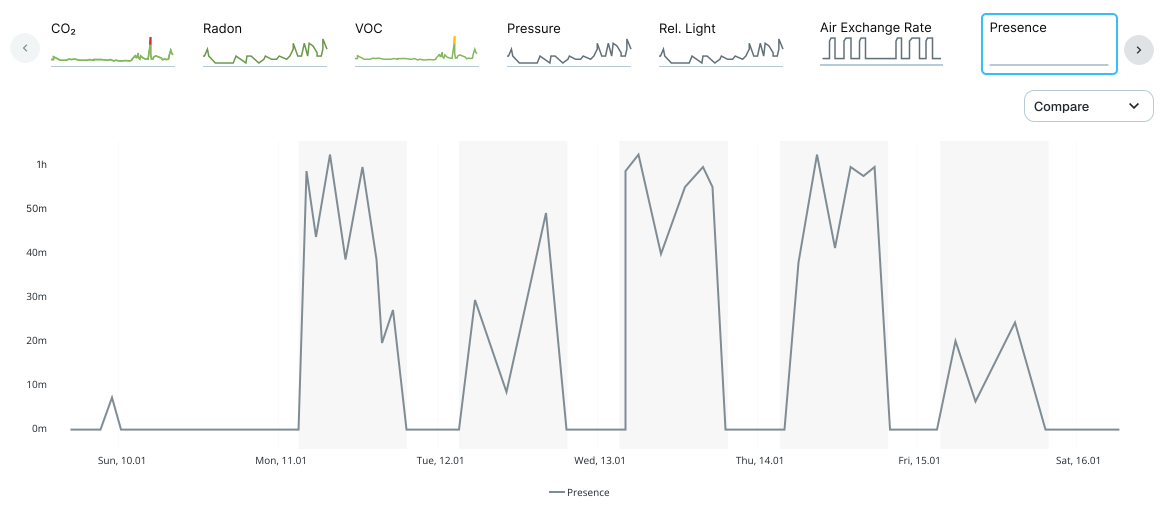
Get insights into when people are present, how many are using each space, and when occupancy peaks across rooms and floors.
binoculars
Remote management
Know what's happening in your building anytime, from anywhere with live dashboard data.
chart-line
Live data & insights
Live insights in the Dashboard show how people are using different rooms in your building or portfolio.
space utilization

No cameras. No personal data. Just environmental data.

Airthings sensors do not use cameras. Instead they use live environmental data, including motion, sound, CO₂ patterns, temperature changes, to tell when a space is in use, without ever identifying who's in it.

eye-slash

No cameras 


Our sensors are environmental, not visual. There is no image, no recording, and no way to identify individuals.
user-circle-dashed

No personal data


Data is aggregated at the room level. We measure that a space is in use, not who is using it. 
hand-heart

Built for trust


Employees can see exactly what's measured and how it's used. No hidden surveillance, no surprises, no need for separate privacy notices.
THE WHY 

Why does space utilization matter?

Space utilization isn't just a workplace strategy metric. It directly affects how much you spend on real estate, how well your hybrid model works, and how efficiently your buildings run.

arrows-in

Right-size your real estate


Most offices are paying for square footage they don't use. Real utilization data shows where to consolidate, expand, or sublet, turning real estate decisions from gut calls into business cases.
intersect

Make hybrid work decisions


Utilization data tells you which days are busy, which spaces get used, and what your hybrid policy is doing in practice.
crosshair

Optimize building services


Cleaning, HVAC, security, and catering all become smarter when they follow actual use instead of fixed schedules. Run services for the spaces people actually are using.

GET STARTED

See space utilization in your buildings

Curious how your spaces are actually being used? We'll show you what Space Utilization looks like in the Airthings dashboard, with the privacy posture and practicality your team needs.

particle-logo

Stop ventilating empty rooms

Our sensors detect when people are actually present. Integrate with your BMS to reduce HVAC run-time by up to 30%.

See how Toma saved 26% on energy bills ->

Ventillation (1)

Resolve complaints with facts

When a tenant claims air quality is poor, share a live link to the data. Prove your building is performing - or spot the exact issue instantly.


Explore dashboard ->

facts (2)
ONE PLATFORM

Explore related insights

Space utilization is one signal among many. Combine it with these for a complete view of your indoor environment.

CO2-3
CO₂
Carbon dioxide
PM-3
PM1
Ultrafine particles (≤1 µm) like viruses or bacteria
PM-3
PM2.5
Fine particles (≤2.5 µm) like dust, smoke and pollution
Radon-2
Radon
Natural, invisible, odorless, radioactive gas 
VOC-2
VOC
Volatile Organic Compounds
Temperature-2
Temperature
Indoor temperature in Celsius or Fahrenheit
Humidity (1)-1
Humidity
Concentration of water vapor present in the air
Light-1
Light 
Luminous flux per unit area (Lux)
gauge
Pressure
Absolute pressure
Noise-1
Noise
Ambient sound in A-weighted decibel (dBA)
Virtual sensors