How to read a radon map, and why you still need to test
TL;DR: A radon map shows where high indoor radon is more likely, based on geology and measured data, but it can't tell you the level in your home. In the US, the EPA groups counties into Zones 1–3; in Canada, Health Canada sets a single guideline of 200 Bq/m³. Both recommend that every home be tested, because two neighboring homes can have very different levels. Use the Airthings radon map to see average indoor levels near you, then test your own home with a long-term (90+ day) measurement.
Radon is an invisible, odorless natural gas that comes from the breakdown of the radioactive element uranium in the ground. It can enter homes and buildings through cracks in foundations or gaps around pipes and build up to dangerous indoor levels. It is the leading cause of lung cancer among non-smokers in both the United States and Canada. In the US, it is linked to about 21,000 lung cancer deaths each year, according to the EPA, and in Canada to about 16% of lung cancer deaths, according to Health Canada.
Are you living in a high-radon area?
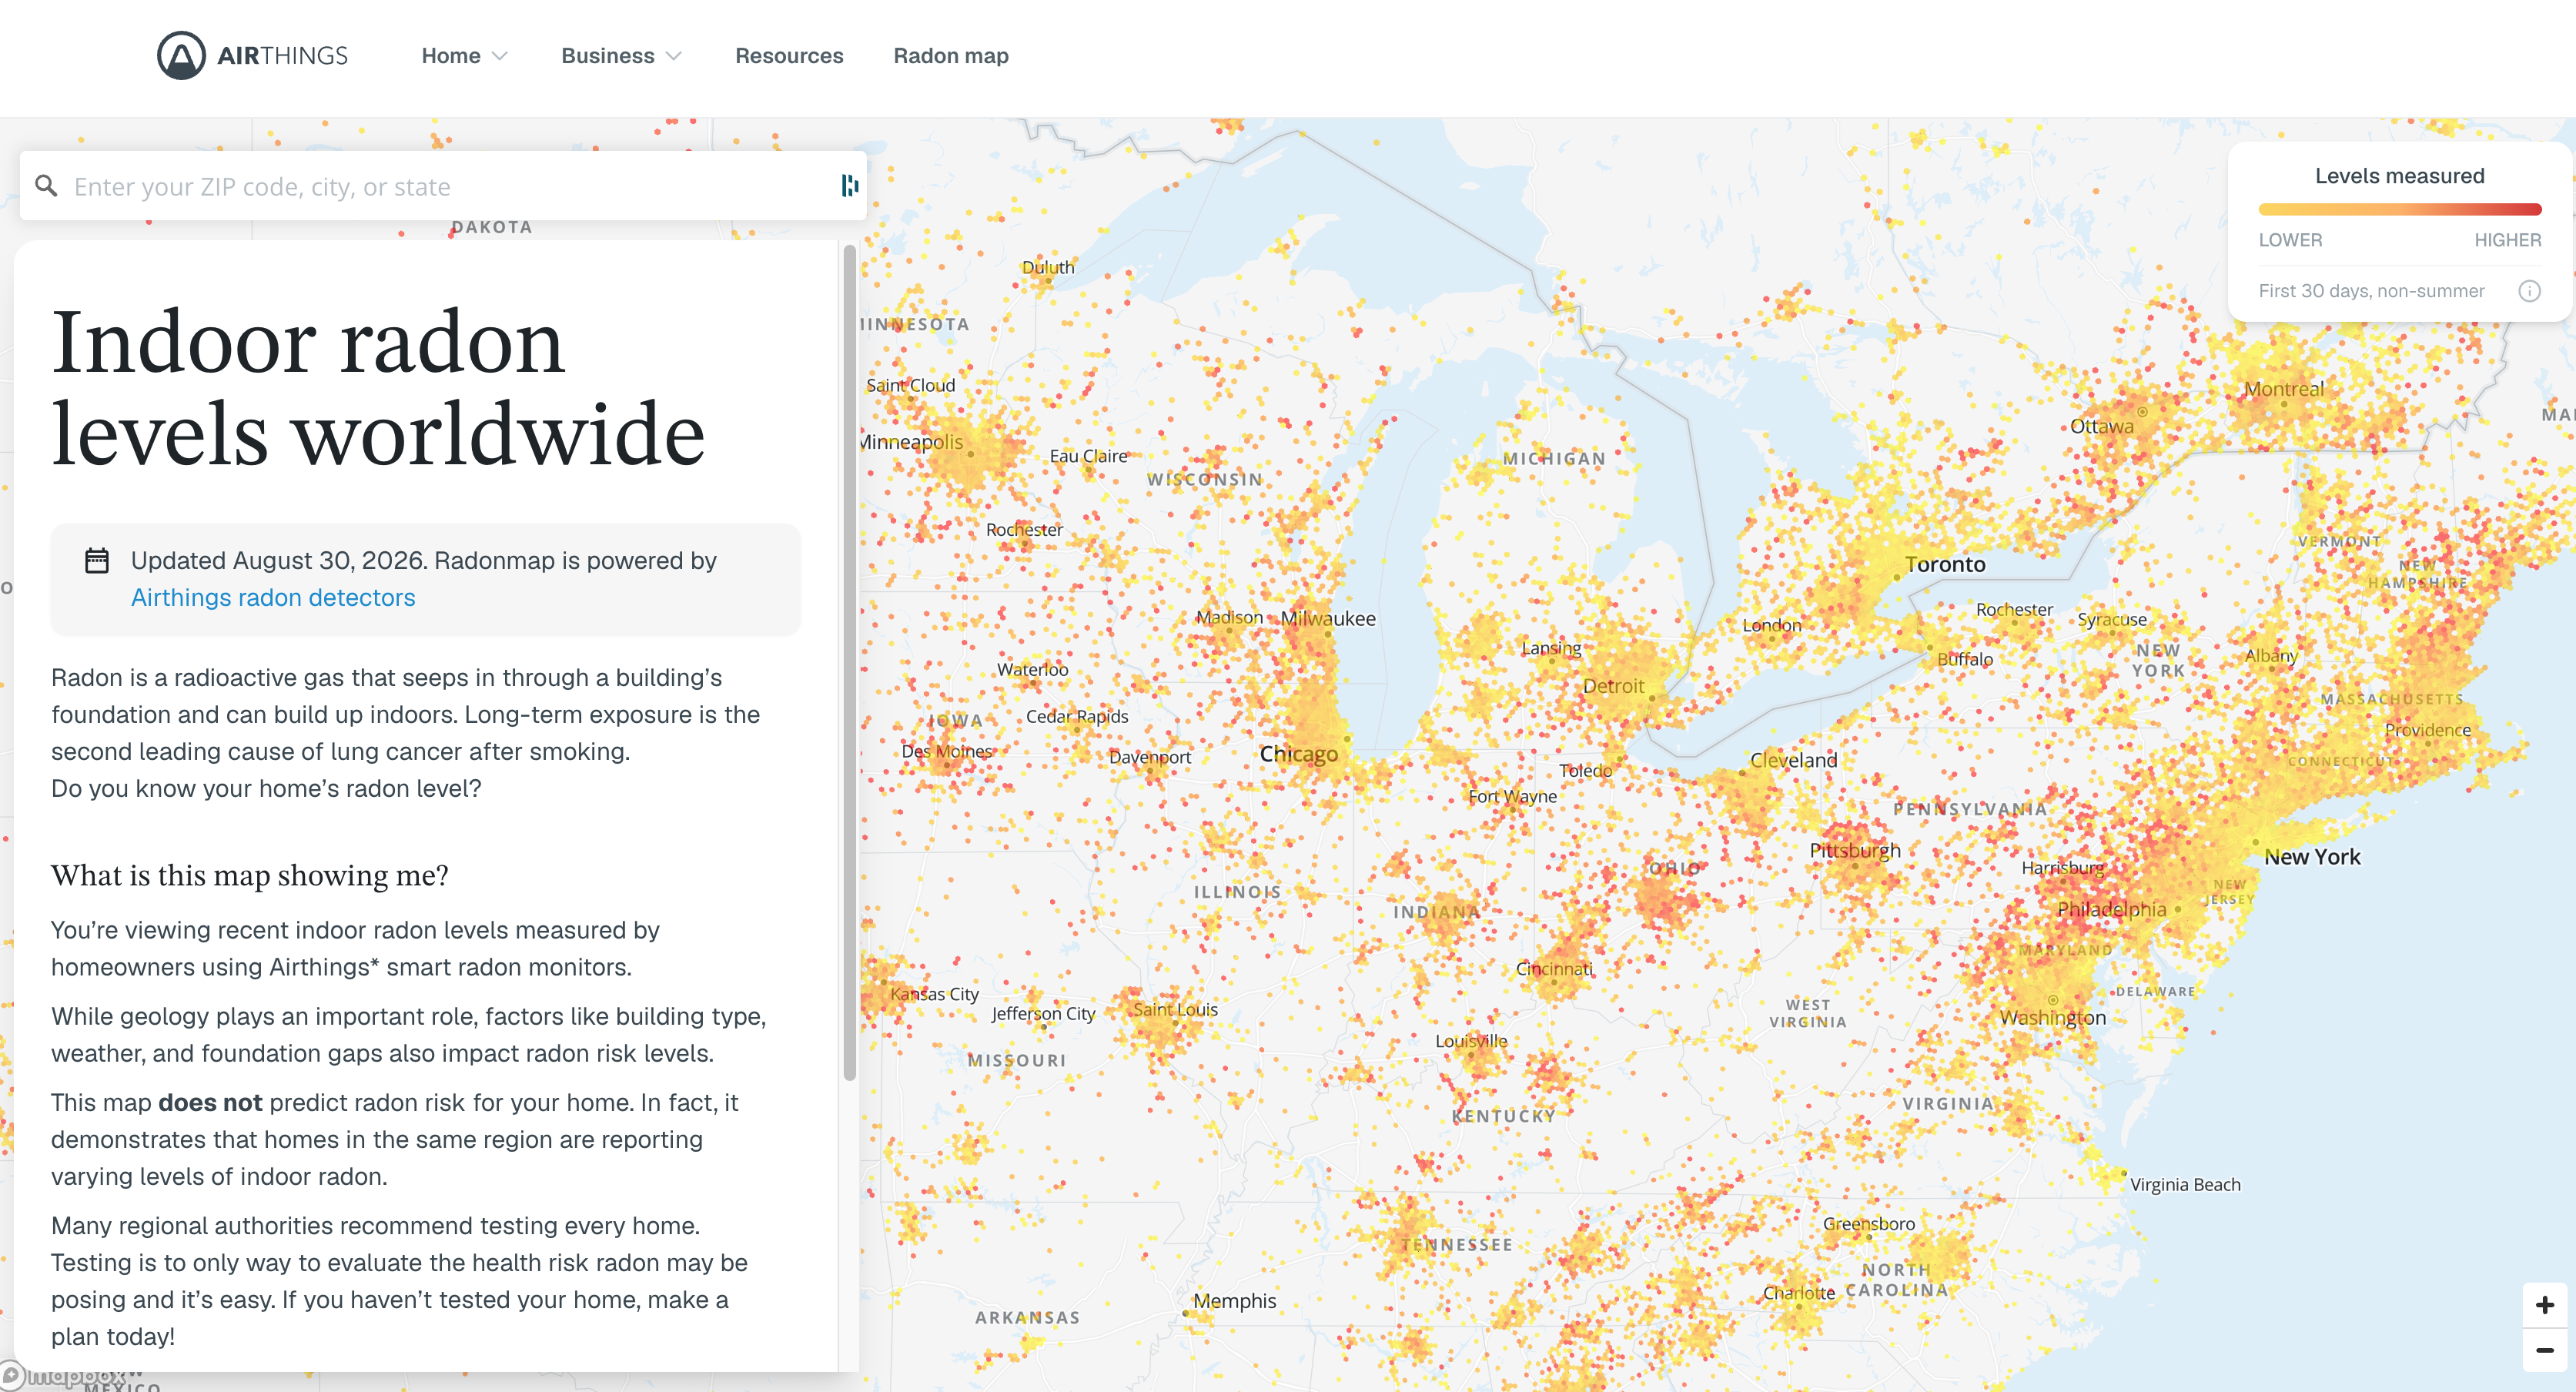
Radon is found everywhere, but because geology and soil composition vary, some areas are naturally higher in radon, making elevated indoor levels more likely. Any home can have radon, and levels can vary widely even between neighboring homes, which is why the EPA and Health Canada both recommend that every home be tested. Use the Airthings radon map below to see the approximate radon level in your city, state, or province. The map is powered by thousands of active Airthings radon sensors, combined with historical data, giving you a regularly updated view of average local levels.
Check radon levels in your area
Search your city, state, or province on the Airthings radon map to see average indoor radon levels measured by Airthings monitors near you.
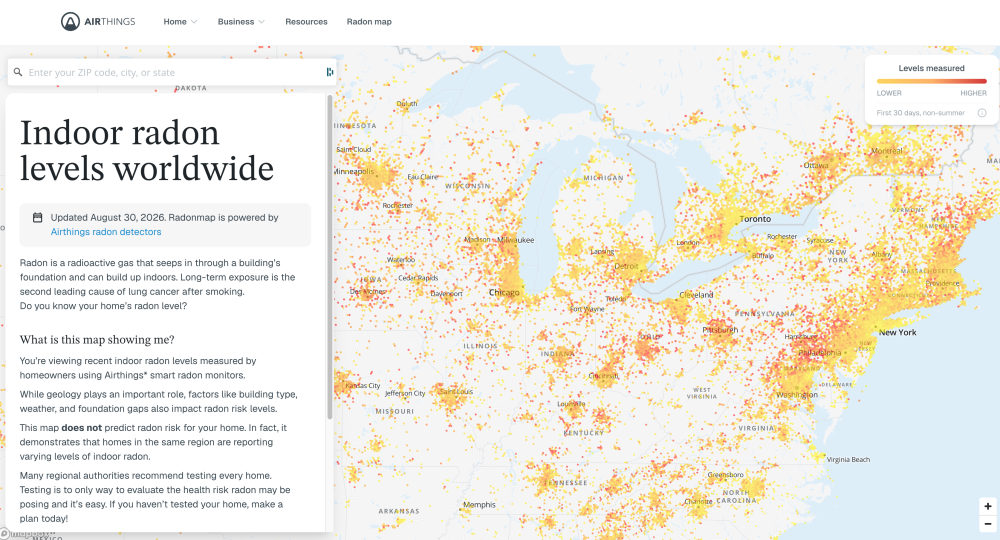
Note: Map averages include homes that have already installed radon mitigation systems, so pre-mitigation levels in some areas may be higher than the map shows.
Radon guidelines in the US and Canada
The US and Canada measure radon in different units and use different guideline levels. In the US, radon is measured in picocuries per liter (pCi/L). In Canada, it is measured in becquerels per cubic meter (Bq/m³). 1 pCi/L is equal to 37 Bq/m³.
| Country | Unit | Guideline | What to do |
|---|---|---|---|
| United States (EPA) | pCi/L | 4.0 pCi/L (148 Bq/m³) action level | Fix your home at 4.0 or above; consider fixing between 2.0 and 4.0 |
| Canada (Health Canada) | Bq/m³ | 200 Bq/m³ (about 5.4 pCi/L) guideline | 200–600 Bq/m³: act within two years. Above 600 Bq/m³: act within one year |
United States: EPA radon zones
The Environmental Protection Agency (EPA) has assigned every US county to one of three radon zones, based on its predicted average indoor radon level.
- Zone 1 (highest potential — red): Counties with a predicted average indoor radon screening level greater than 4.0 pCi/L (148 Bq/m³), the EPA's action level.
- Zone 2 (moderate potential — orange): Counties with a predicted average between 2.0 and 4.0 pCi/L.
- Zone 3 (low potential — yellow): Counties with a predicted average below 2.0 pCi/L.
Important: The EPA zones were created to help governments and building code officials target radon-resistant construction. They were never intended to decide whether an individual home needs to be tested. Homes with high radon are found in all three zones.
Canada: Health Canada's radon guideline
Canada does not divide the country into official radon zones. Instead, Health Canada sets a single guideline of 200 Bq/m³ (about 5.4 pCi/L) for homes. If your long-term test result is above this level, Health Canada recommends reducing it: within two years for results between 200 and 600 Bq/m³, and within one year above 600 Bq/m³. Health Canada recommends a long-term test of at least three months, ideally during fall and winter, when radon levels are typically highest.
A radon map is a guide, not a guarantee
Looking at a radon map is a good first step, but it comes with an important caveat: radon is highly localized and varies a lot from house to house. You can't rely on a map or your neighbor's test results to know your own home's level.
Because radon enters through cracks and gaps in a foundation, two houses next door to each other can have very different levels. Your neighbor's house might test low at 1.2 pCi/L (44 Bq/m³), while yours, built on slightly looser soil, with a deeper basement, or with different ventilation, might test at 8.0 pCi/L (296 Bq/m³), twice the EPA action level.
Newer homes add another factor. Energy-efficient, airtight homes exchange less air with the outdoors, so radon that gets in can build up to higher levels than in an older, draftier home on the same street.
What to do if you live in a high-radon area
Whether the map shows high radon near you, you live in an EPA Zone 1 or Zone 2 county, or you simply want peace of mind, the only way to know your level is to test your own home. Our guide on how to test your home for radon covers every option step by step.
Because radon levels fluctuate daily with temperature, barometric pressure, and HVAC use, a single short-term test can be misleading. The EPA and Health Canada both point to long-term testing (90 days or more) for the most accurate picture of your average, and a continuous digital monitor makes that easy. Not sure which device to use? See how to choose a radon detector.
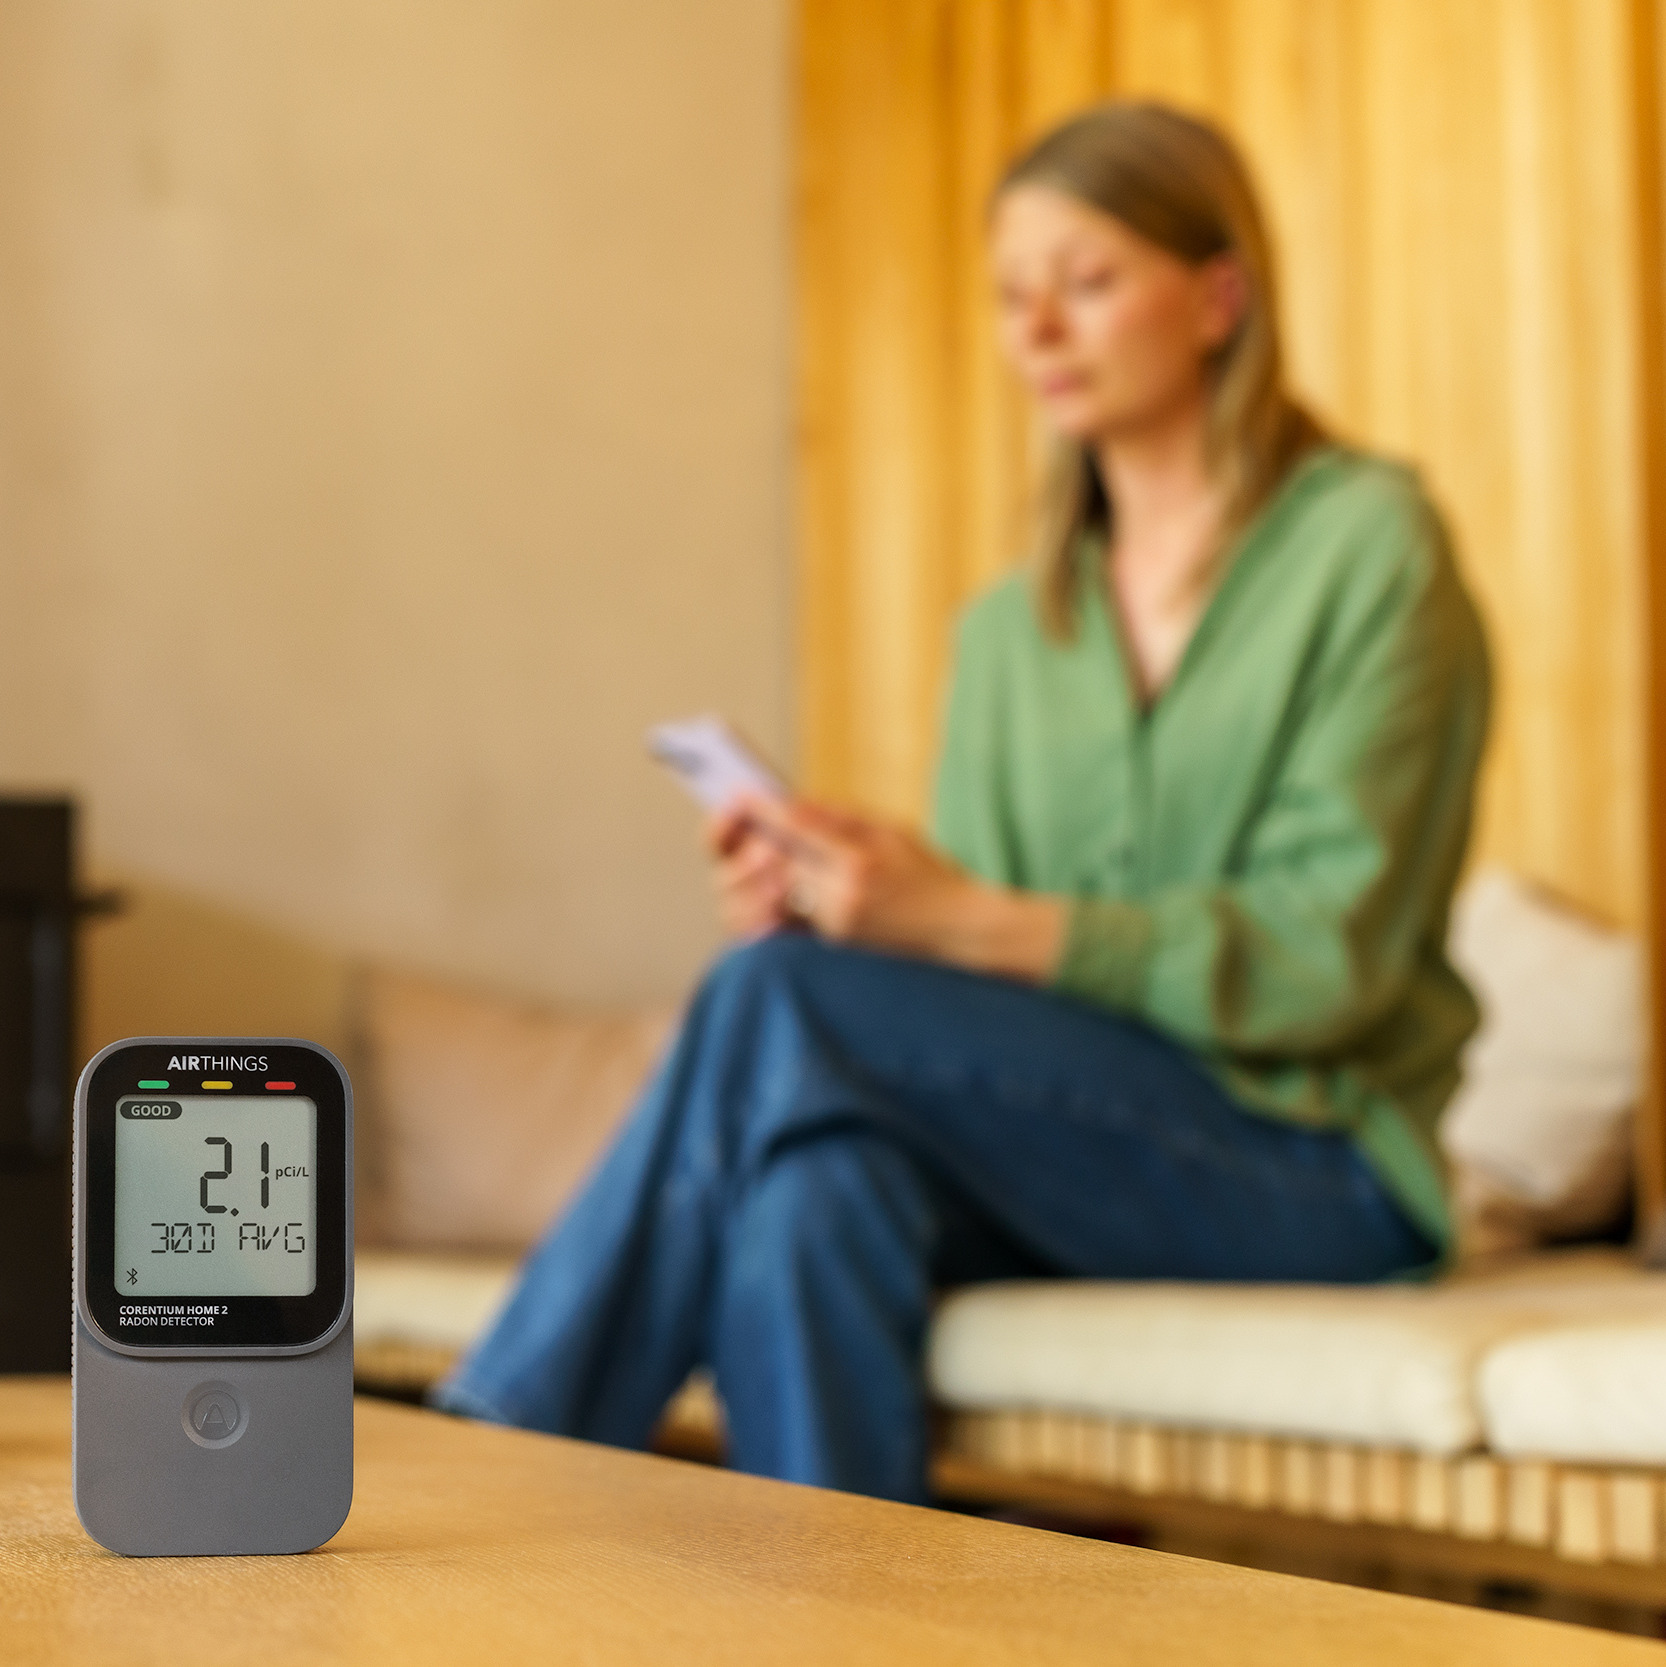
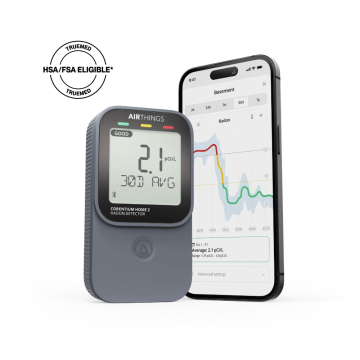
- Use a continuous digital radon monitor: Place an Airthings Corentium Home 2 or View Plus in the lowest lived-in level of your home (usually a basement or ground-floor living room).
- Understand your radon average: You will see a useful picture within the first 30 days, but both the EPA and Health Canada base their guidelines on long-term averages, so let the monitor run for at least 90 days before you judge your average.
- Act if levels are high: If your long-term average is at or above 4.0 pCi/L in the US, or above 200 Bq/m³ in Canada, contact a certified radon mitigation professional (in Canada, look for C-NRPP certification). Mitigation systems are effective and long-lasting; see what radon mitigation typically costs. We also have a guide to DIY radon mitigation steps you can try first.
- Keep monitoring: Even after mitigation, keep tracking your radon levels. Fans can fail and soil conditions can change, so radon can return. Continuous monitoring tells you your system is still working.
Frequently asked questions
Which US states have the highest radon levels?
Radon is found in all 50 US states. States in the Upper Midwest and Appalachian regions, including Iowa, North Dakota, South Dakota, Pennsylvania, and Ohio, are among those with the highest share of homes testing at or above the EPA action level of 4.0 pCi/L, largely because of uranium-bearing rock and soil. See average indoor levels by state on our US radon map.
Which Canadian provinces have the highest radon levels?
Radon is found in every province and territory. Health Canada's Cross-Canada Survey of Radon Concentrations in Homes found the highest percentages of homes above the 200 Bq/m³ guideline in Manitoba, Saskatchewan, New Brunswick, and Yukon, but high-radon homes were found in every region, including major cities such as Calgary, Winnipeg, and Ottawa.
Is radon worse in the summer or winter?
Indoor radon levels are usually higher in winter. When warm indoor air rises and escapes through the upper parts of a heated home, it lowers the air pressure near the foundation and draws more soil gas, including radon, inside. This is called the "stack effect." Windows and doors also stay shut in winter, so less fresh air dilutes the gas. Radon can still be high in summer, though, especially in basements and in homes where exhaust fans or HVAC systems lower indoor air pressure.
Do I need to test if my home doesn't have a basement?
Yes. Basements are closest to the soil and often have the highest levels, but homes built on concrete slabs or over crawl spaces can still have high radon. The gas moves through cracks, construction joints, and gaps around pipes into living areas. Every home should be tested.
Sources

-
September 13, 2026| Posted in Guides| Annabel Robertson| 7921
How to choose the best radon detector for your home (kits vs monitors)