.png)
 Radon is a colorless, odorless, radioactive gas that kills approximately 58 people a day in the US alone. It is emitted naturally through the breakdown of uranium underground and seeps into classrooms through cracks in the building's foundation, where it can rise to unhealthy levels.
 Every time we breathe out, we emit carbon dioxide (CO₂). When a classroom is full of active students, the CO₂ levels rise extremely quickly, which can lead to drowsiness, poor decision making, low concentration spans and low productivity.
 VOCs originate from cleaning agents, solvents, air fresheners, candles and are even emitted by humans. When you have an enclosed space like a restroom, these emitted gases accumulate and pollute the air we breathe.
 A shift in atmospheric pressure is proven to cause headaches, which negatively impacts students' learning abilities.
 The humidity of a room is very important. Dry air can make infectious disease transmission easier, while the most prevalent health effect caused by moisture-induced mold formation is asthma; 21% of the 21.8 million cases of asthma annually are attributable to residential dampness and mold.
 Computer rooms can get very hot, students' learning capacities are negatively affected at higher temperatures.
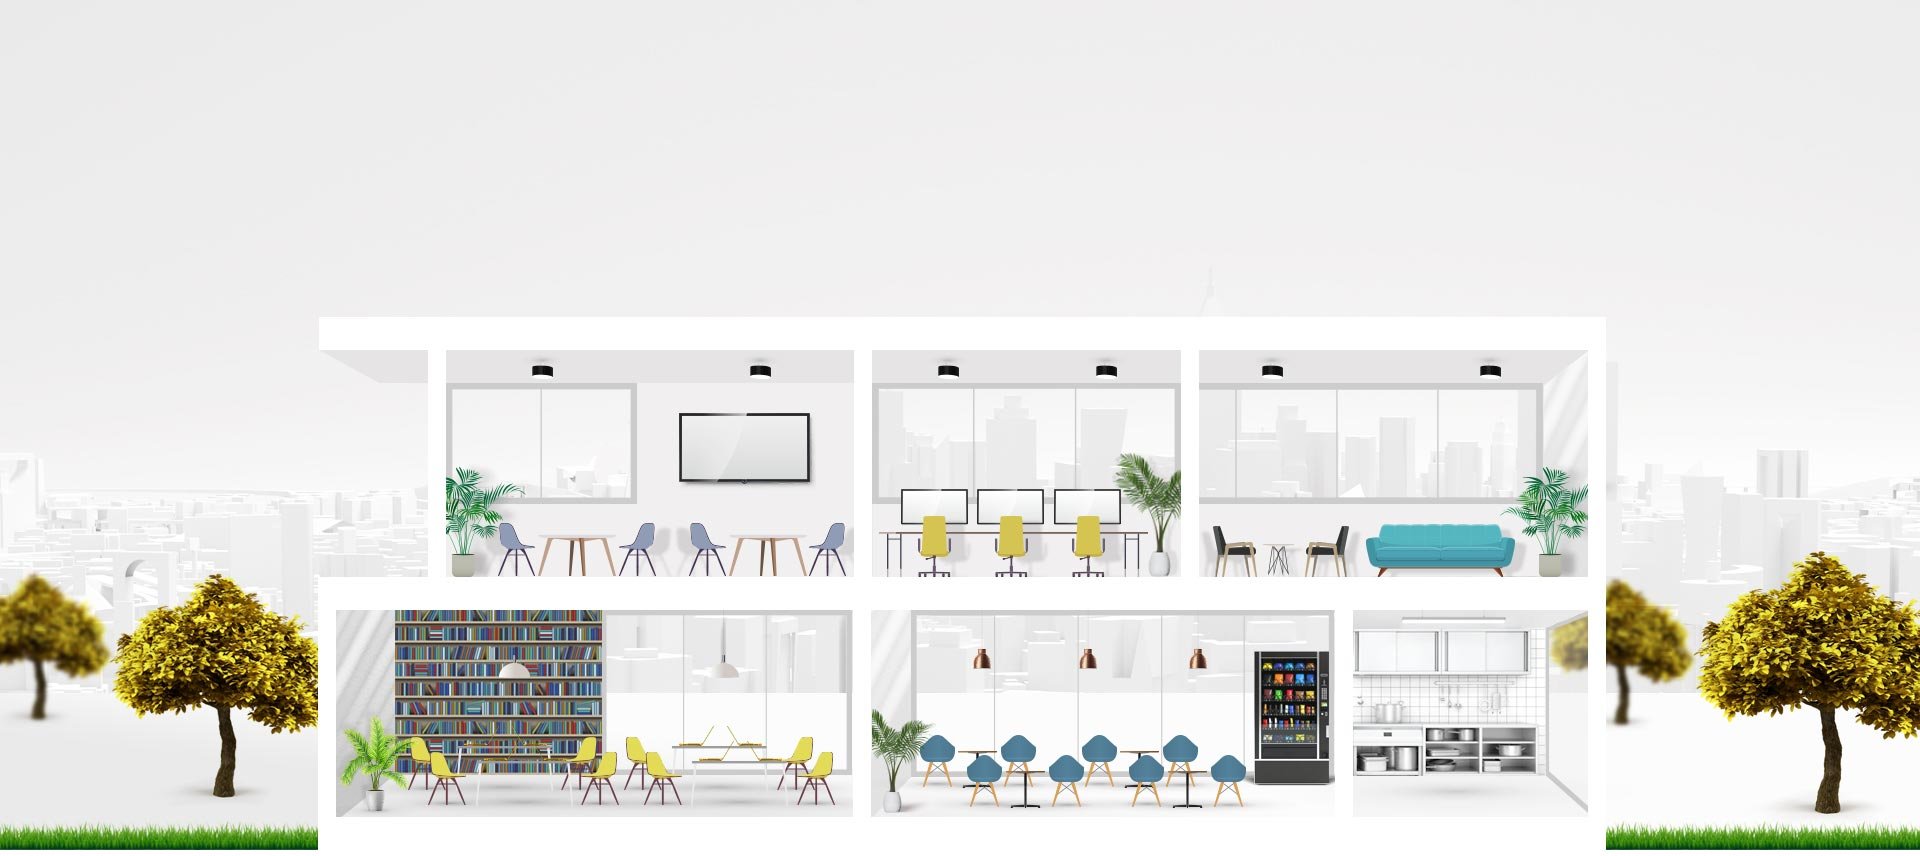


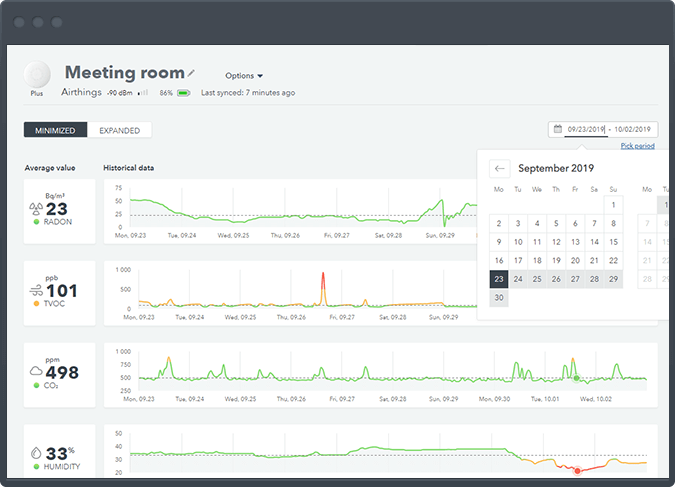
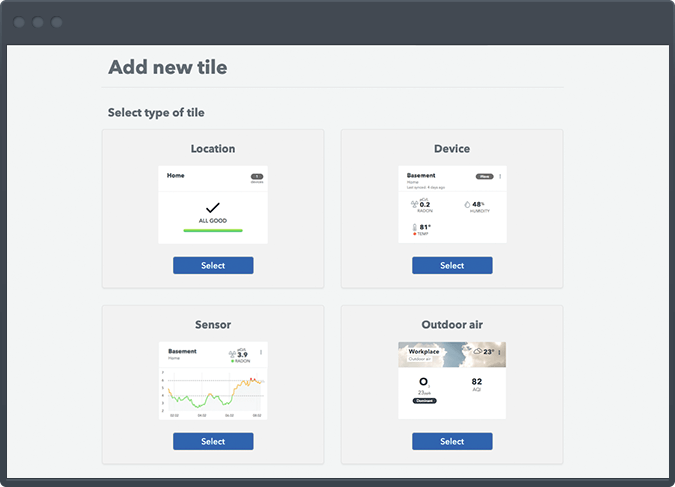
Monitoring the indoor air improves productivity, reduces sick leave and lets you optimize your energy usage. Ensuring a safe and healthy environment in kindergartens, schools, colleges and universities.

Good air quality can result in a 61% improvement in cognitive tasks, and classrooms often have the worst air quality in the building.

Healthy air lowers the survival rate of viruses and reduces sick leave by 58%. Poor air quality and radon levels can lead to health problems including cancer.

Monitoring takes the guesswork out of ventilation, so you only use energy when you need to. Saving energy costs vacations and weekends.
.png)
CO2
Temperature
Humidity
Radon
Airborne chemicals (VOCs)
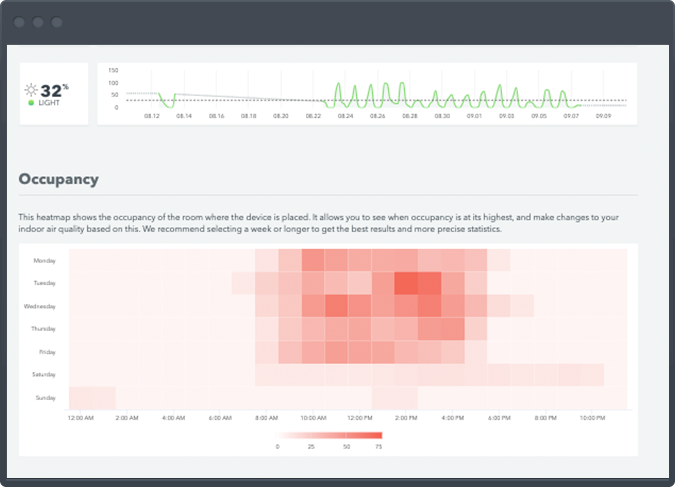
Occupancy
Pressure
Light
Mold risk
Virus risk
For buildings where people thrive but viruses don't. Reduce the survival rate of airborne virus and the risk of viruses spreading in your building.
 Global (English)
 USA (English)
 Canada (English)
 Denmark (English)
 Norway (Norsk)
 Sweden (English)
 UK (English)