
Skip to content
virus_risk
VIRTUAL SENSOR

Virus Risk Indicator

Understand, monitor, and reduce airborne virus risk across your portfolio using real-time air quality data and insights.

How does airborne virus spread indoors?

Airborne viruses spread indoors through microscopic droplets that can linger in the air for hours and travel through a building's ventilation.

Three environmental conditions amplify or reduce that risk: humidity (which affects how long viruses survive in the air), temperature (which affects how well immune defenses work), and the ratio of ventilation to occupancy (which determines how concentrated the shared air becomes).

virus risk modals

Stop reacting. Start optimizing.

Gain complete visibility into your building operations, eliminate budget surprises,
and transition from "firefighting" to high-performance management.
facility_manager_notifications

Built for facility mangers

Save time

→ Get a quick overview of your entire portfolio from anywhere

→ Prioritize worst-performing spaces first

→ Generate compliance reports in minutes, not hours

Stay ahead of problems

→ Real-time alerts when conditions exceed thresholds

→ Use trend data to predict and prevent issues

→ Fix problems before they become complaints

Seamless integration

→ Connect to your BMS for automated HVAC optimization
→  Receive alerts in Slack, Teams, or email
→  API access for custom dashboards and analytics


Easy to deploy and maintain

→ Fully wireless sensors, no complex cabling
→  Long battery life means minimal maintenance
→ Scale easily as your portfolio grows


What do the risk levels mean?

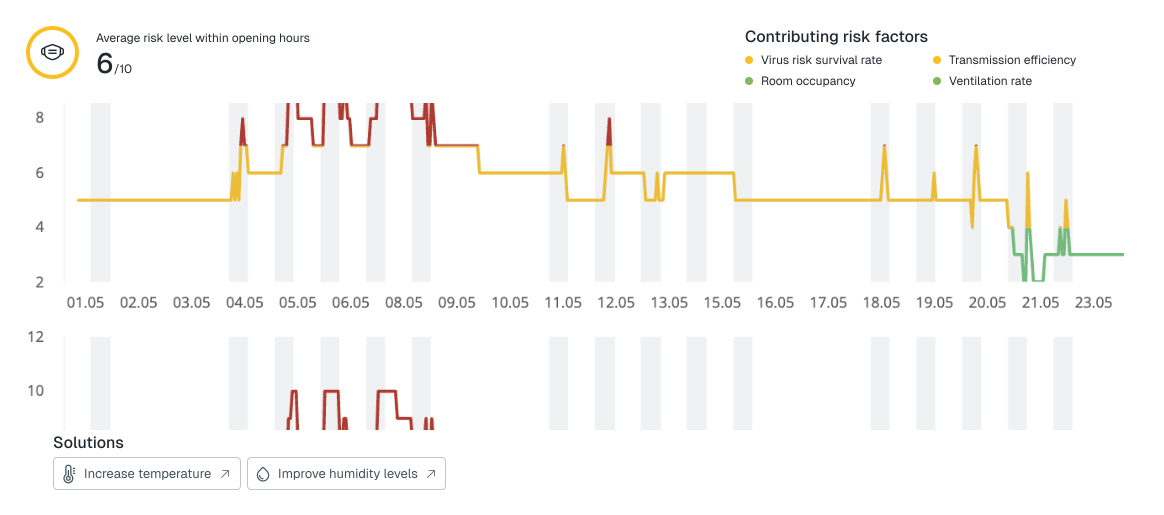
The Airthings Virus Risk Indicator combines these signals into a single 1–10 score
so you can see where conditions favor transmission and act before it spreads.
green dot (1)

1-4

Status: This is normal
Conditions don't favor airborne transmission

Recommended action
Maintain current ventilation, occupancy, and humidity

yellow dot (1)

5-7

Status: Take action
One or more factors are pushing risk upward

Recommended action
Follow the dashboard's tailored suggestions to lower the score

red dot (1)

8-10

Status: Warning
Conditions strongly favor transmission

Recommended action
Act immediately: ventilate, reduce occupancy, adjust humidity
IN THE DASHBOARD 

How the virus risk indicator works

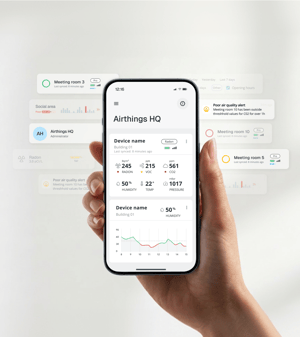
A single score per space, updated in real time, with the context to act on it.

eye_icon
Understand your risk
See elevated virus risk areas across your building by floor, room, or time.

speedometer
Take targeted action
Identify key risk drivers to take precise, cause-based action.

notification_icon
Set custom alerts
Get instant notifications when risk scores exceed your set thresholds.
virus risk
WHY IT MATTERS


The four factors that drive airborne virus risk

The Virus Risk Indicator combines four environmental factors (each backed by peer-reviewed research) into a single 1–10 score that's updated in real time.

microscope

FACTOR 1

Virus survival


How long airborne microdroplets remain viable in the air. Survival times shift dramatically with humidity and temperature. Viruses live longer in cold, dry air than in warm, moderately humid conditions.

fan

FACTOR 2

Ventilation


How much fresh outdoor air is diluting the indoor air. Higher ventilation rates remove contaminated air faster; recirculation without filtration just moves the same air around.


occupancy_icon

FACTOR 3

Room occupancy


How many people are sharing the air, and how densely. More occupants in a fixed volume means more shared exhaled air and a higher concentration of any airborne pathogens being released.

shield-plus

FACTOR 4

Immune system


How well the body's airway barriers function in current conditions. Low humidity and cold air reduce mucus barrier function, making infection more likely even at the same airborne dose.


See Virus Risk in action

THE MODEL 

Why monitor virus risk?

Airborne virus risk isn't visible,  but it's measurable through the environmental conditions that drive it. Monitoring those conditions gives building operators three things they can't get from cleaning protocols or distancing rules alone

eye (1)

Understand which spaces are at risk

By monitoring the four factors continuously, you see which areas in your building have elevated airborne transmission risk and why. Different spaces have different problems and need different solutions.


goal

Act on the cause, not the symptom

With insight into which factor is driving the score in each space, the action you take matches the actual cause. Low humidity gets a humidifier; high occupancy gets a ventilation adjustment; recirculated air gets a filter check.


heart-3

Build trust with occupants or tenants

Continuous monitoring shows employees, students, parents, and tenants that you're taking the indoor environment seriously. It also gives you the data to back up that commitment when someone asks.

GET STARTED

See virus risk indicator in your buildings

Curious how airborne virus risk behaves across your spaces? We'll show you what the Virus Risk Indicator looks like in the dashboard and how facility teams use it to take targeted action.

particle-logo

Stop ventilating empty rooms

Our sensors detect when people are actually present. Integrate with your BMS to reduce HVAC run-time by up to 30%.

See how Toma saved 26% on energy bills ->

Ventillation (1)
ONE PLATFORM

Explore related insights

Virus risk is one signal among many. Combine it with these for a complete view of your indoor environment.

CO2-3
CO₂
Carbon dioxide
PM-3
PM1
Ultrafine particles (≤1 µm) like viruses or bacteria
PM-3
PM2.5
Fine particles (≤2.5 µm) like dust, smoke and pollution
Radon-2
Radon
Natural, invisible, odorless, radioactive gas 
VOC-2
VOC
Volatile Organic Compounds
Temperature-2
Temperature
Indoor temperature in Celsius or Fahrenheit
Humidity (1)-1
Humidity
Concentration of water vapor present in the air
Light-1
Light 
Luminous flux per unit area (Lux)
gauge
Pressure
Absolute pressure
Noise-1
Noise
Ambient sound in A-weighted decibel (dBA)
Virtual sensors