 Global (English)
 USA (English)
 Canada (English)
 Denmark (English)
 France (Français)
 Germany (Deutsch)
 Italy (Italiano)
 Norway (Norsk)
 Spain (Español)
 Sweden (English)
 UK (English)
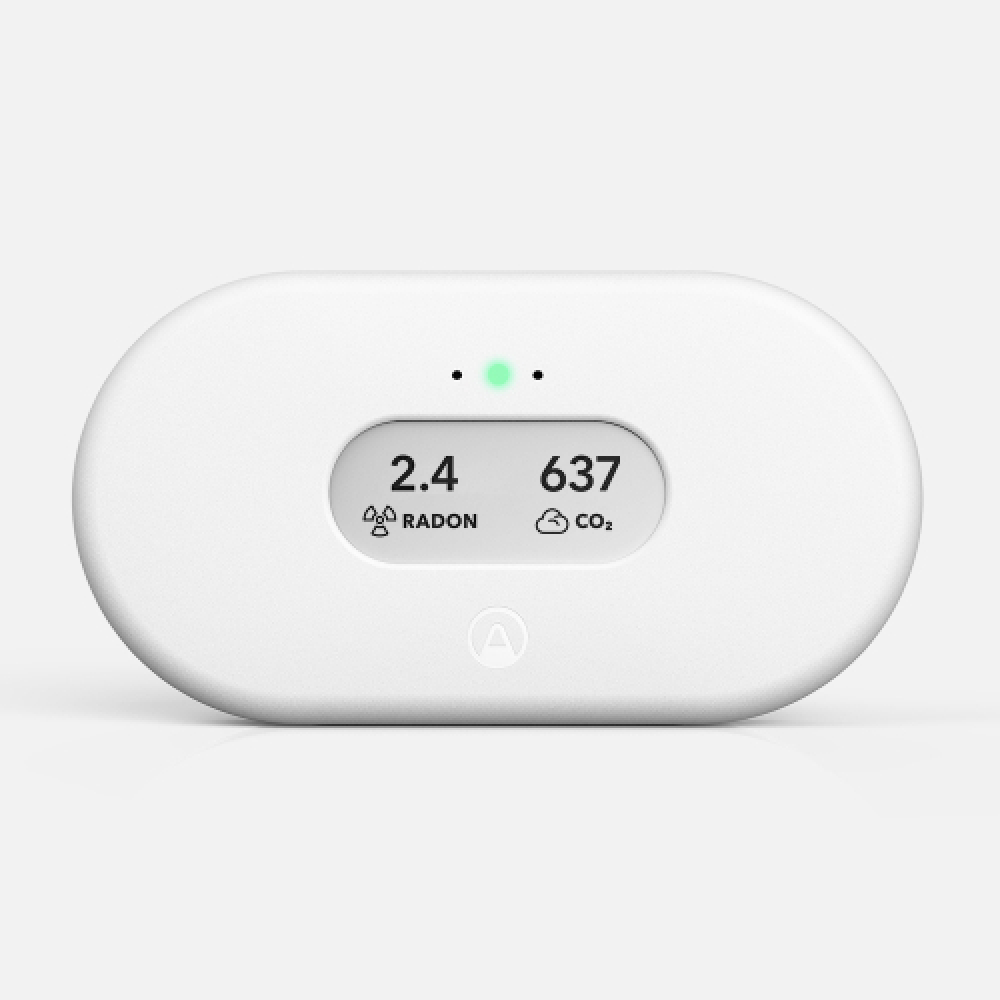
%20(1)%20(1)%20(1).webp)
-2.png?width=1024&height=512&name=Untitled%20design%20(22)-2.png)
Airthings’ new report reveals the air Americans and Canadians breathed at home deteriorated in 2023 due to the summer's wildfires.
Key takeaways
- For this report, we analyzed over 2 billion data points from more than 11,500 smart indoor air quality monitors across the United States and Canada.
- The annual average level of indoor air pollution or particulate matter (PM2.5) rose by more than 17% in the United States and Canada in 2023 compared to 2022 (7.43µg/m³ vs 6.26µg/m³ respectively).
- The annual average level of indoor air pollution for 2023 was 39% higher than the recommended levels for safe air (<5µg/m³) from the World Health Organization's (WHO) air quality guidelines.
- In 2023, Americans and Canadians spent 1,211 hours of their year, or almost 14% of the time breathing air above the WHO’s recommended levels for safe air compared to 936 hours in 2022. This equates to more than a 29% increase compared to 2022.
- Smoke and particulates from last summer's wildfires significantly contributed to 2023 becoming the worst year for indoor air pollution on our record.
AUTHOR

.png)
Michael Donnelly
Insights & Community Engagement
press@airthings.com
2023 was recently confirmed as the hottest year on record, with global temperatures increasing by close to 1.5°C from the pre-industrial average. This stratospheric rise has been attributed to climate change by the Intergovernmental Panel on Climate Change (IPCC) and numerous other respected scientific bodies. Unfortunately, the heat isn’t the only problem that is getting worse. 2023 marked both a year and summer that saw air quality in the news for all the wrong reasons. Most notably, due to multiple large wildfires in North America in 2023, to the shock of its residents, New York City's iconic skyline turned into an orange dystopian smog for almost a week in June. Outdoor air quality readings from the most polluted days of the year's ‘wildfire season’ showed particulate matter (PM) levels as high as 120µg/m³, more than 200 times what the World Health Organization (WHO) considers safe to breathe. The story was covered by major news networks around the world, including CNN, The New York Times, and many more.
-1.png)
What is particulate matter?
Particulate matter, or PM, isn’t just one contaminant or pollutant. It’s the scientific term for a range of particles of dust, dirt, and liquids that become suspended in the air, the collection of which is more commonly referred to as air pollution. These particles can get into your lungs, and through them, into your bloodstream where they can seriously impact your health and wellbeing. The most commonly measured size of particle is PM2.5, which are 2.5 microns or less in diameter and are therefore able to enter the bloodstream. The most important thing you need to know is, that lower PM means healthier air, as PM rises, the health of the person breathing it, declines.
Why you should care about pollution indoors
The US Environmental Production Agency (EPA) estimates that we spend 90% of our time indoors. Therefore, what happens indoors is typically far more likely to influence our long-term health than outdoor air. Numerous studies show how exposure to elevated levels of air pollution can lead to Alzheimer's disease, antibiotic resistance, and millions of premature deaths. But while outdoor air may often garner more attention from the government, press, and public, such as during this summer’s ‘wildfire season,’ we should instead talk more about indoor air pollution once we account for human behavior.
How we made this report
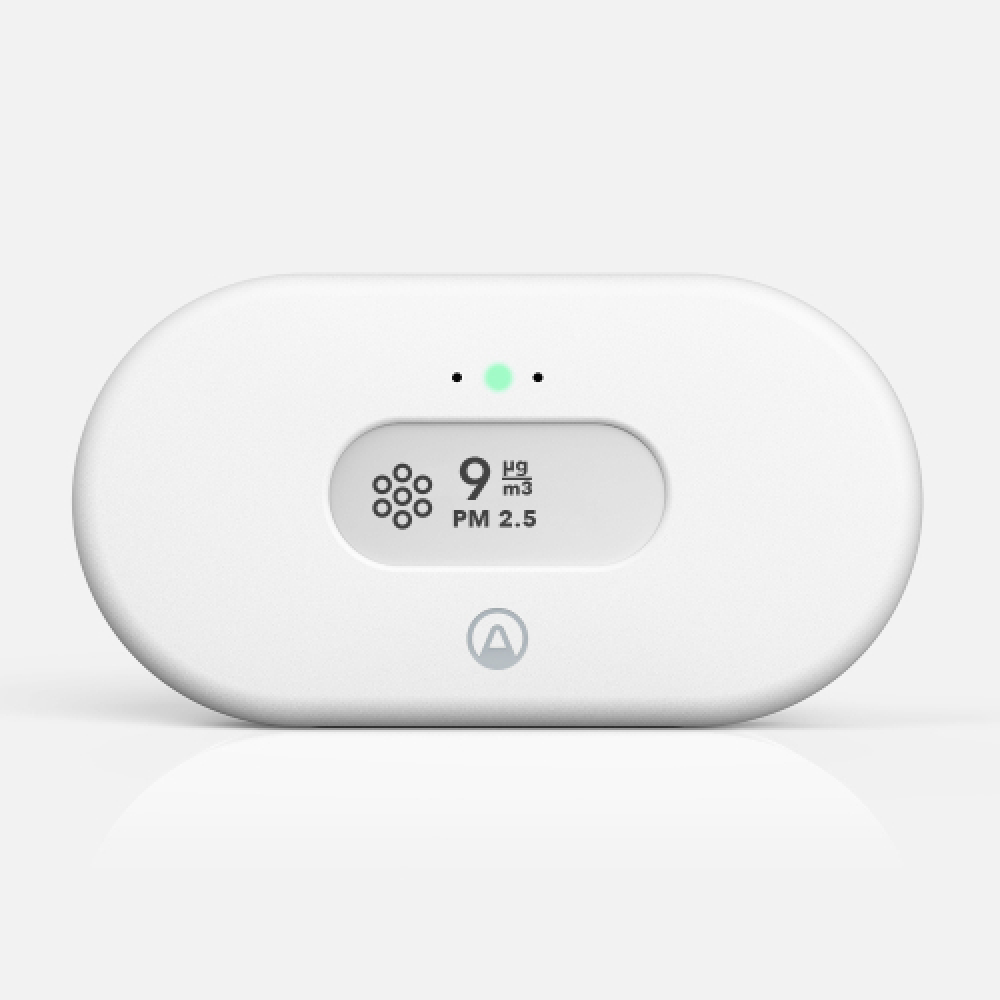
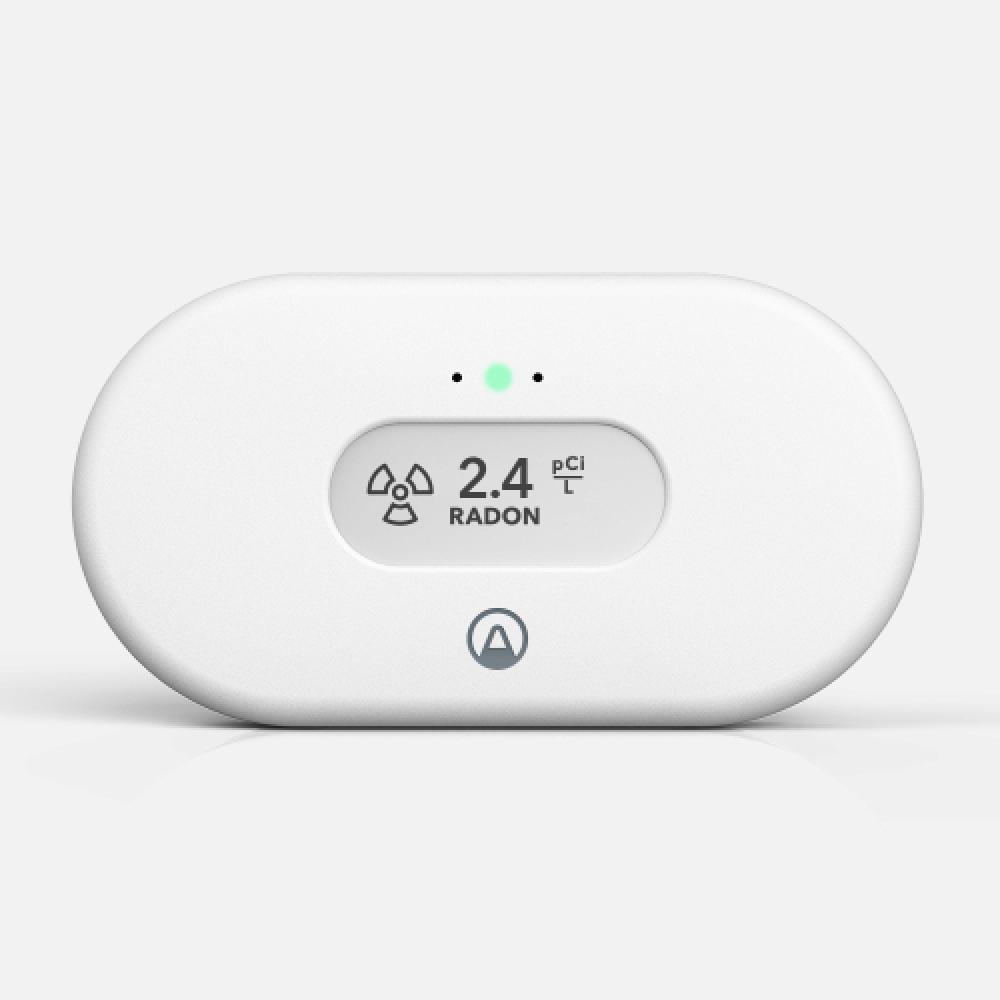
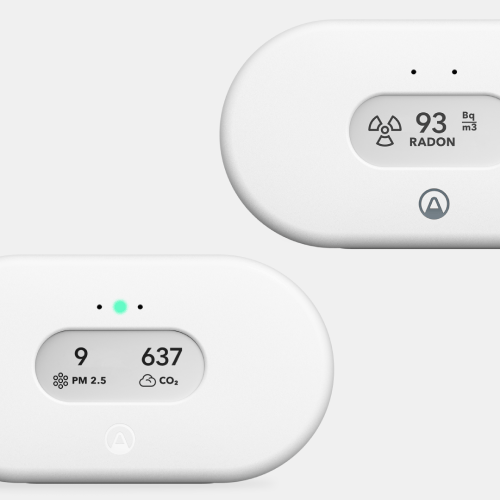
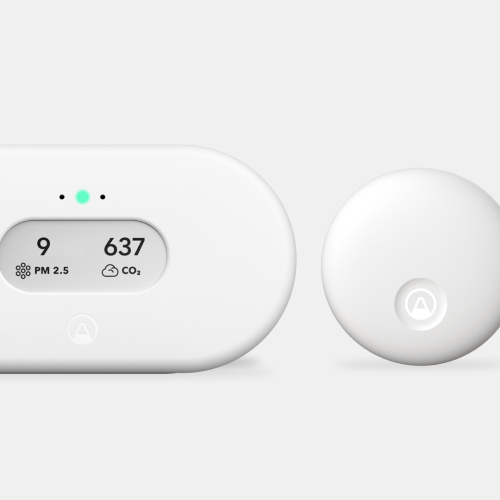
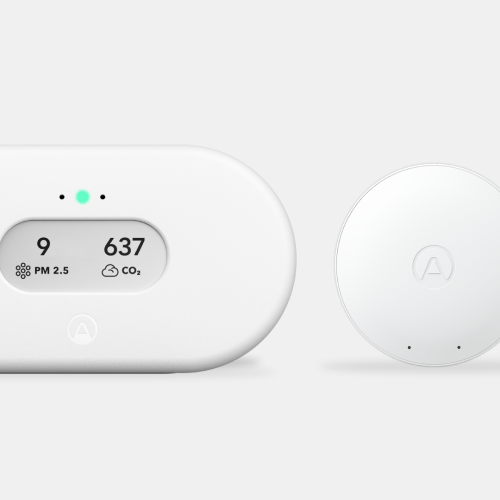
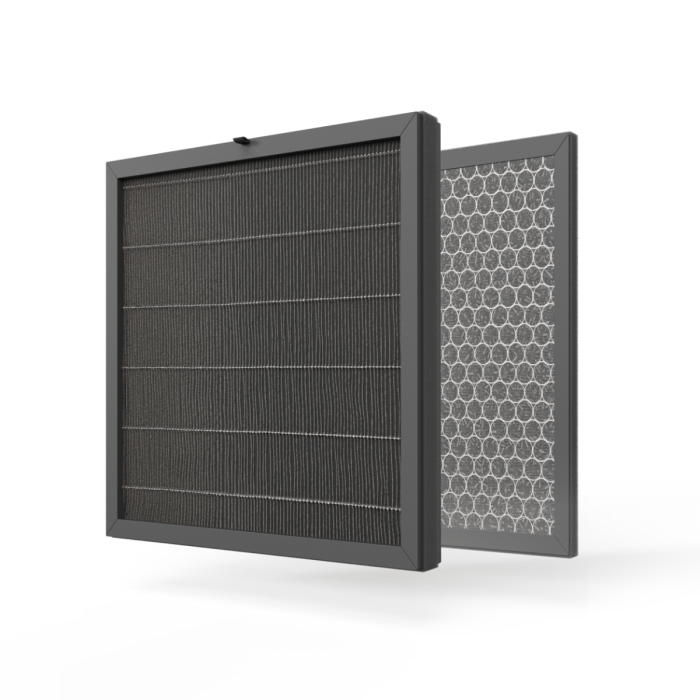
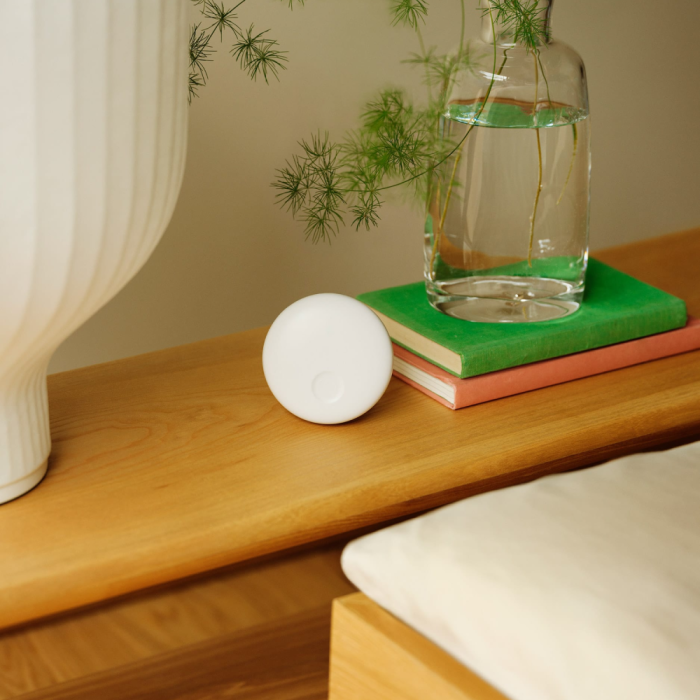
Each year as experts in indoor air quality monitoring, we produce a report on the trends we see from our air quality monitor data. This year we examined more than 2 billion anonymized data points from almost 12,000 active smart air quality monitors active in North America with PM2.5 sensors (pictured below). In total, we used 11,950 monitors in the report, 9,139 from the US and 2,811 from Canada with monitors present in every US state and each province in Canada. Since 2011, Airthings has sold more than 1,000,000 air quality monitors and radon detection devices. However, less than 7% of Airthings devices historically sold worldwide are equipped with a PM2.5 sensor from which data can be gathered remotely since the start of 2023. Since launching the first smart product with a PM2.5 sensor in 2021 (View Plus), demand has steadily increased for devices with this capability. Growth projections and trends indicate this technology will continue to represent a larger share of the Airthings product portfolio. Currently, more than 90% of our customer base resides in the US (≈70%) or Canada (≈20%). In light of this representation, and with outdoor air pollution dominating national news in these countries, we sought to uncover what happened to the indoor air in North America as the outdoor air worsened during last summer’s disastrous wildfires.
.png)
Indoor air quality worsens while wildfire smoke filters into homes
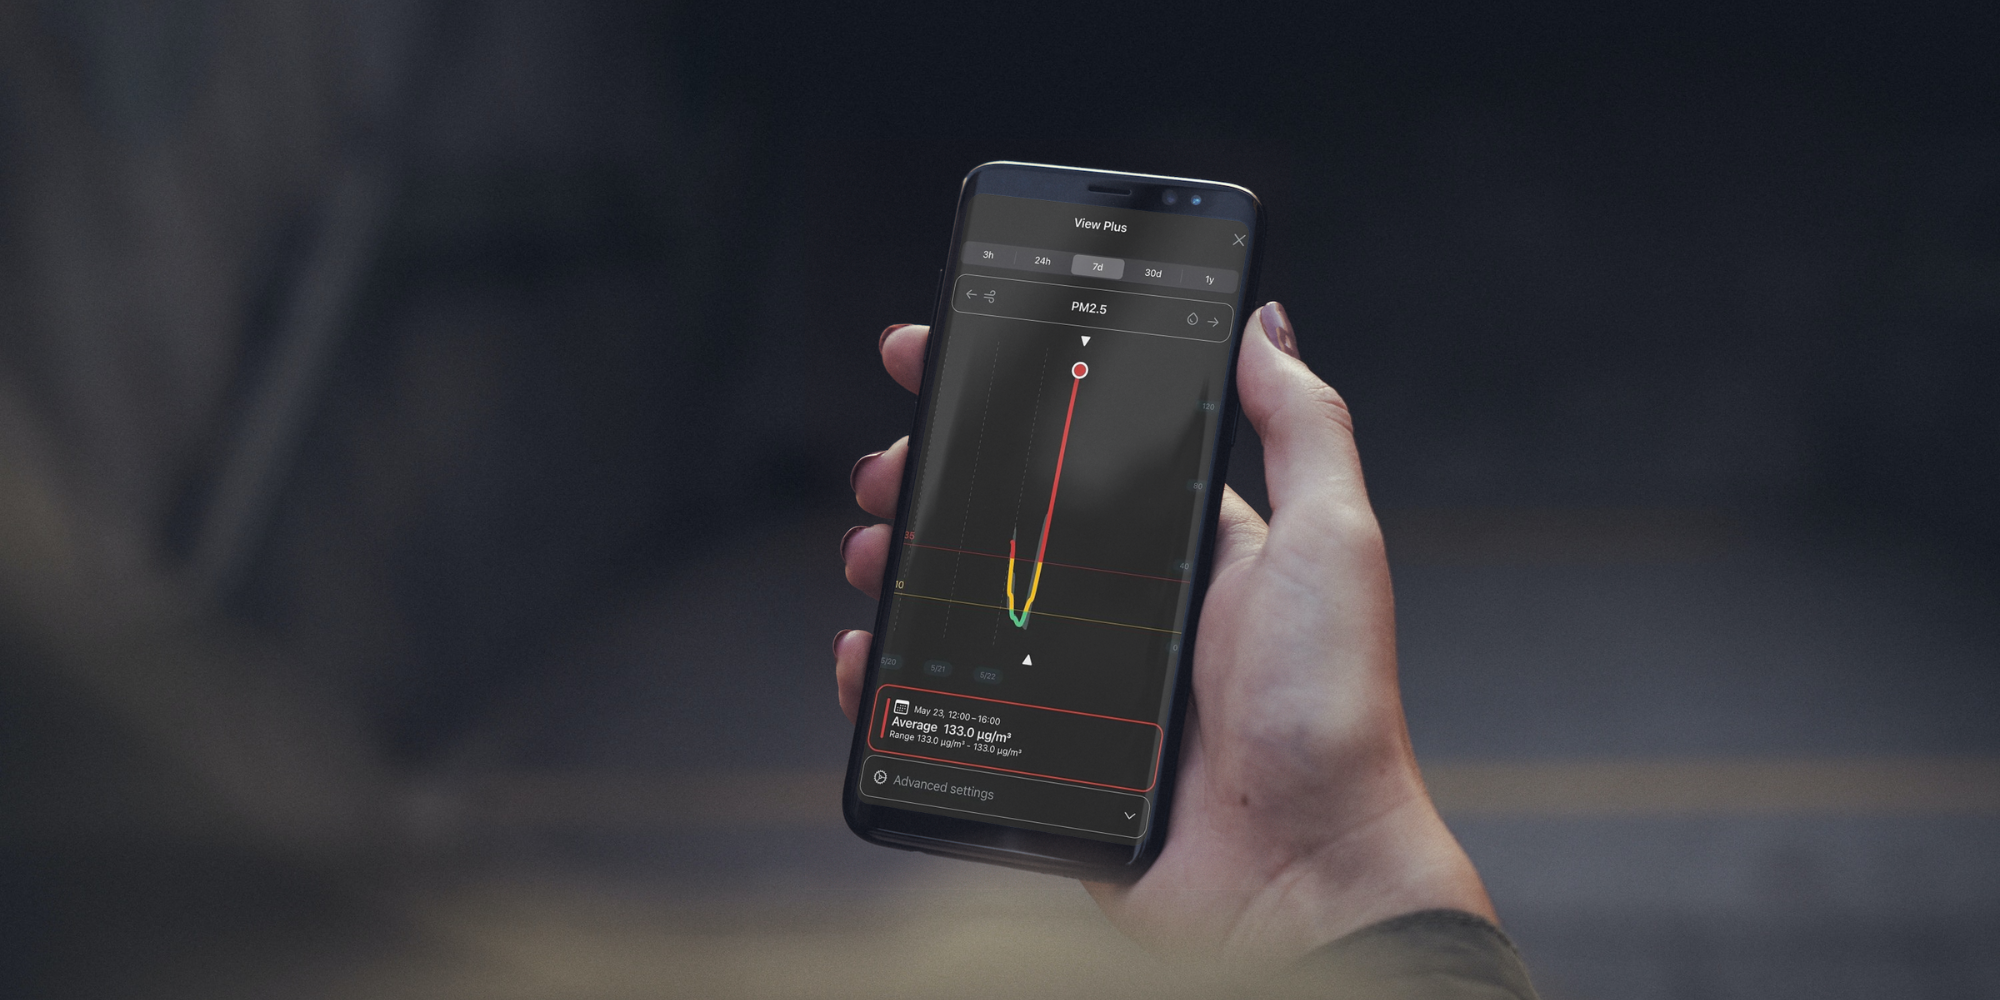
Using the WHO's air quality guidelines or safe air threshold of <5µg/m³ as our benchmark, we can see that the average PM2.5 reading of more than 11,500 monitors across the US and Canada was well above the recommendation for healthy air. The largest spike in air pollution levels occurred during the summer. During this same period, wildfires raged across North America. The effects of this spike in indoor air pollution lasted until September when PM readings fell to levels similar to the same period in 2022. Overall, the average PM levels across 2023 were more than 17% higher than readings in 2022 (7.43µg/m³ vs 6.26µg/m³).
.png)
People are breathing worse air, for longer
2023 saw our air quality monitors in the US and Canada register extremely unhealthy levels for more than 25% longer than the same average in 2022. (which is classified as anything above 25µg/m³ according to Airthings air quality thresholds). This equates to an additional 275 hours of exposure to poor quality air.
.png)
"These findings about indoor air pollution levels, although startlingly high, are likely lower than what we can expect to see from the population at large. This is considering that those with our air quality monitors have a specific interest in air and likely have access to more air quality insights than the average person. It’s common to think that when we close our doors and windows nothing from outside can get inside, but we see this is not the case with outdoor air pollution. We hope this report empowers people to further consider and improve the quality of the air they breathe.”
- Oyvind Birkines, CEO of Airthings
How to reduce indoor air pollution levels
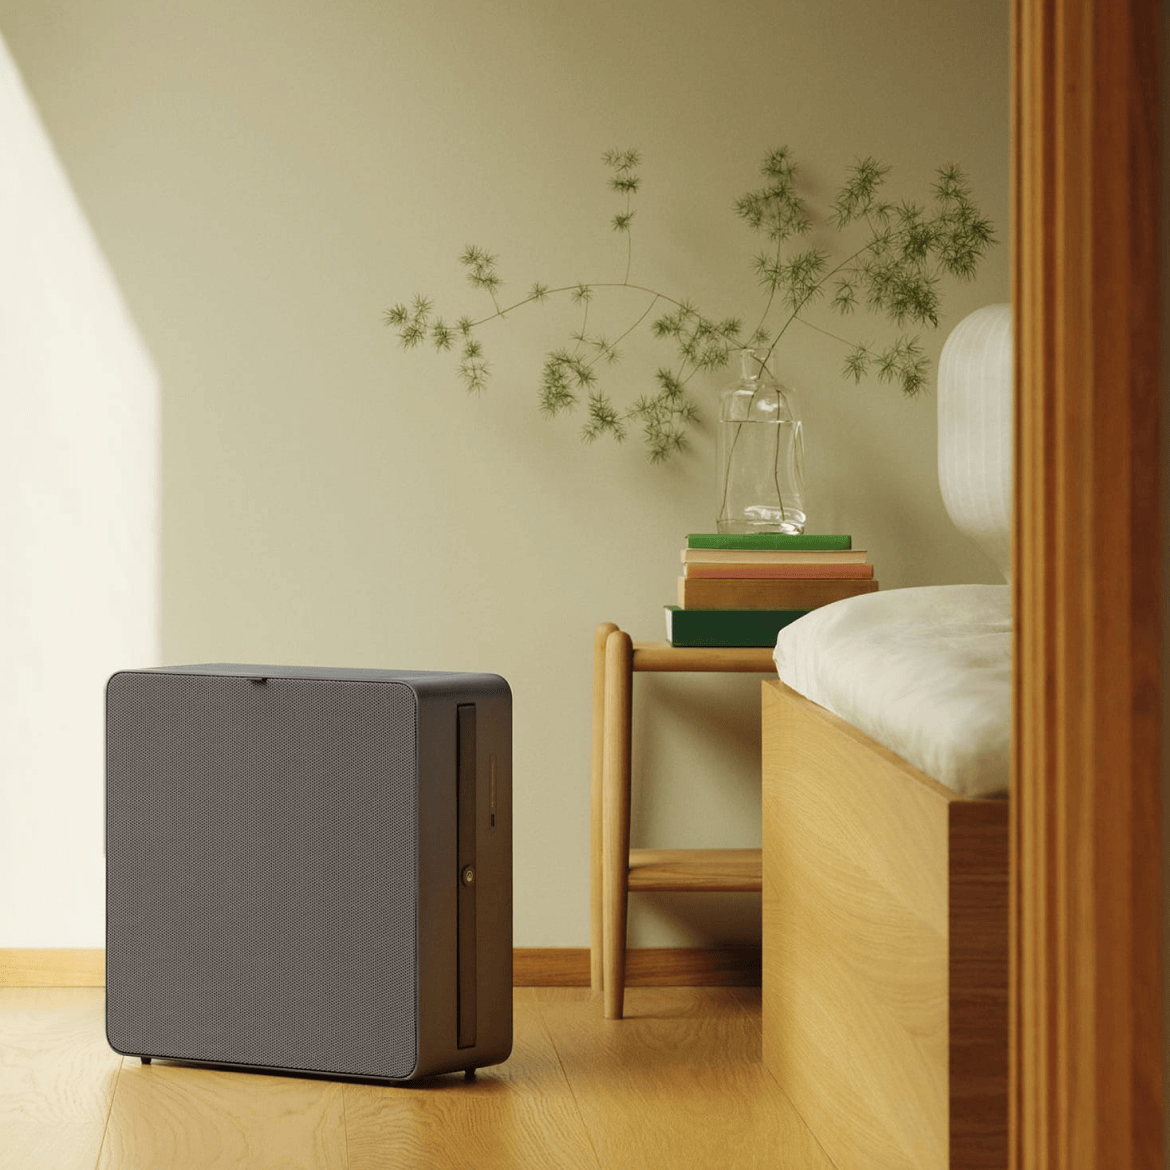
During periods when outdoor pollution is known to be bad, it is best to close any openings to your home, such as windows, doors, or chimneys. However, as we know from this report, this will not likely stop all forms of pollution from entering your home. If you own an air quality monitor, you can detect if this step is sufficient to safeguard your indoor air quality. However, if your indoor PM levels rise and air quality worsens, using an air purifier is the quickest way to bring them back to a healthy level.
Other indoor air quality insights from 2023
Note: Red hours are the amount of time (in hours) where the average measured levels of an air contaminant throughout that hour were poor or very unhealthy according to Airthings air quality thresholds.
CO₂
CO₂ red hours (>1000 ppm) fell by 11% from 2022 to 2023.
The month for highest CO₂ levels was July, with an average reading of 730 ppm. This period of the summer is typically when North Americans turn on their air conditioning units and therefore close their windows.
Particulate Matter (PM2.5)
PM2.5 red hours (>25µg/m³) rose by 17% from 2022 to 2023.
The average level of PM2.5 in 2023 in the US was 7.32µg/m³, which was lower than Canada's average level of 7.64µg/m³. Notably, both country's average levels were comfortably above the WHO air quality guideline of <5µg/m³.
Radon
Radon red hours (>4pCi/L or >150Bq/m3) fell by 14% from 2022 to 2023. This demonstrates that the radon levels of Airthings users are drastically improving year on year.
Volatile organic compounds (VOCs)
VOC red hours (>2000ppb) fell by almost 18% from 2022 to 2023.
The year’s highest VOC readings occurred in the week after Black Friday, a period typically associated with unpackaging new items and putting up Christmas trees or other decorations in the home. Levels increased by 6% to reach 203ppb before dropping another 5% in the following week.
Demand for indoor air quality monitors in North America
Since 2011, Airthings has been creating the leading air quality monitors and best-selling radon detectors. Last year, Airthings sold their millionth device worldwide. Notably, more than 850,000 of these devices have been purchased in the US and Canada.
About Airthings
Airthings is a global technology company and producer of award-winning radon and indoor air quality monitors for homeowners, businesses, and professionals. Founded in 2008, Airthings is on a mission to ensure that people around the world recognize the impact of indoor air quality and take control of their health through simple, affordable, and accurate technology solutions while optimizing energy consumption in buildings. Airthings’ products have made radon detection and indoor air quality monitoring easy to deploy, accurate, and user friendly, and have received several accolades including the TIME's Best Inventions award and CES Innovation Award Honors. Headquartered in the heart of Oslo, Norway, and with offices in the US and Sweden the company has over 135 employees from more than 35 nationalities—and counting. To see the full range of Airthings indoor air quality monitors, radon detectors, and air purifiers or to learn more about the importance of continuous air quality monitoring, please visit airthings.com
Sources
1. Copernicus: 2023 is the hottest year on record, with global temperatures close to the 1.5°C limit. (n.d.). Copernicus. https://climate.copernicus.eu/copernicus-2023-hottest-year-record
2. Climate Change in Data: The Physical Science basis. (n.d.). https://www.ipcc.ch/. https://www.ipcc.ch/report/ar6/wg1/resources/climate-change-in-data/
3. Van Dam, D., & Ramirez, R., (2023, June 7). New York City’s air pollution among the world’s worst as Canada wildfire smoke shrouds Northeast. CNN: US. https://edition.cnn.com/2023/06/06/us/new-york-air-pollution-canada-wildfires-climate/index.html
3. Wilson, M. (2023, June 7). Orange skies and burning eyes as smoke shrouds New York City. The New York Times. https://www.nytimes.com/2023/06/07/nyregion/nyc-wildfire-smoke-scenes.html
4. Improving your indoor environment | US EPA. (2023b, May 15). US EPA. https://www.epa.gov/indoor-air-quality-iaq/improving-your-indoor-environment
5. Air pollution linked to dementia cases. (2023, September 12). National Institutes of Health (NIH). https://www.nih.gov/news-events/nih-research-matters/air-pollution-linked-dementia-cases
6. Mohammed, M. (n.d.). Air pollution linked with global rise in antibiotic resistance. The Conversation. https://theconversation.com/air-pollution-linked-with-global-rise-in-antibiotic-resistance-211249
7. World Health Organization: WHO. (2019b, July 30). Air pollution. https://www.who.int/health-topics/air-pollution
8. World Health Organization: WHO. (2021, September 22). What are the WHO Air quality guidelines? https://www.who.int/news-room/feature-stories/detail/what-are-the-who-air-quality-guidelines