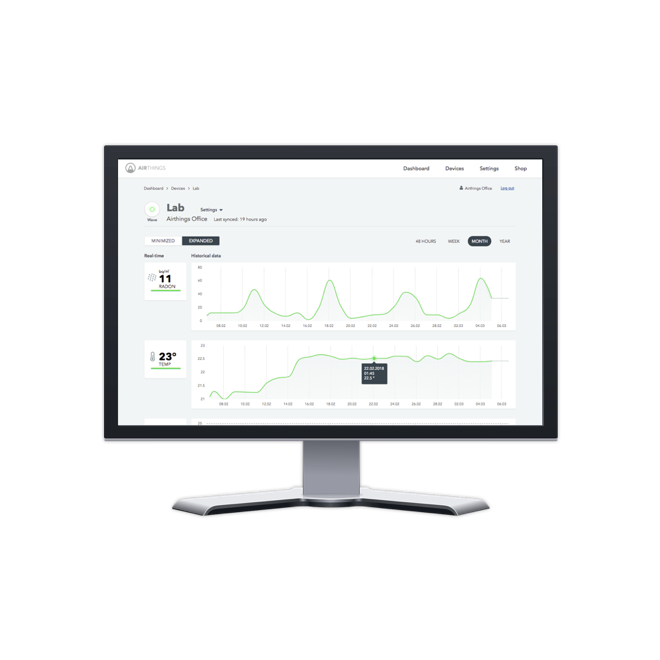
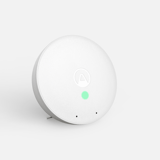
Selecciona el área que te interesa y aprende más sobre la calidad del aire y los productos que ofrecemos.
Quickly view, customize and analyze the sensor data from all of your devices at a glance. You’ll also have access to trends and advanced analytics.
Continuous monitoring of your Indoor Air Quality is necessary to minimize potential health effects. The Airthings online dashboard provides a quick and easy solution to view, compare and export data for your particular needs.
Identify potential to enhance ventilation and other money saving options
Monitor multiple rooms and/or locations and receive alerts when your air quality is poor
Export to a CSV file to further analyze your data
Analyze historical data, compare spaces and add and remove devices
Identify potential to enhance ventilation and other money saving options
Monitor multiple rooms and/or locations and receive alerts when your air quality is poor
Export to a CSV file to further analyze your data
Analyze historical data, compare spaces and add and remove devices
Know when to open your windows and air things out, or when to keep your indoor air from being contaminated by outdoor pollutants. The Airthings Dashboard now includes an Outdoor Air Quality tile. Real-time information on your local outdoor air contaminants as well as the overall air quality (AQI). Click “add new tile” in the dashboard to get started.
Simply log in with the information you used when setting up your Airthings device. The Dashboard will already be loaded with the data from all of your devices.
The dashboard contains multiple types of tiles which you can add and remove, drag and drop, and resize to customize your dashboard to fit your particular preferences.
Device tiles
Device tiles sum up the sensors on that device. Click on a device tile to drill down on that device and get more detailed information.
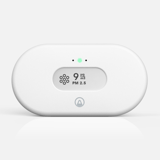
Sensor tiles
Sensor tiles show a graph of your levels for an individual sensor. Customize by changing the width of the tile, or changing the display between 48 hours, one week, month or year.
For each device you are able to inspect the values of the different sensors and gain the opportunity to compare them and how they relate. This is also where you will export your raw data.
≥150 Bq/m3
≥100 and <150 Bq/m3
<100 Bq/m3
≥2000 ppb
≥250 and <2000 ppb
<250 ppb
≥1000 ppm
≥800 and <1000 ppm
<800 ppm
≥70 %
≥60 and <70 %
≥30 and <60 %
≥25 and <30 %
<25 %
>25 °C
≥18 and ≤25 °C
<18 °C