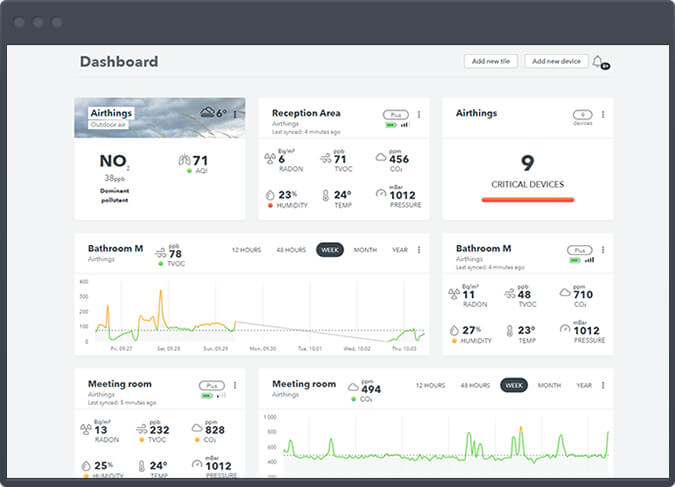
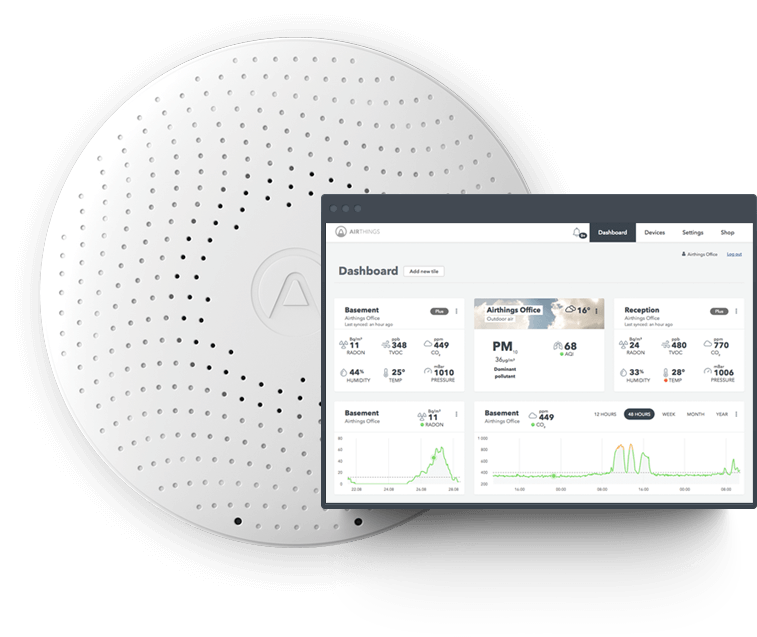
The Airthings Dashboard gives you the air quality data you need to take action at the earliest opportunity. With on-demand access to current and historical data you can optimize ventilation and air quality within your building, ensuring you provide a healthy and productive environment for all its users.
Get an overview of all rooms, floors and locations. Receive automated alerts should conditions change and air quality deteriorate.
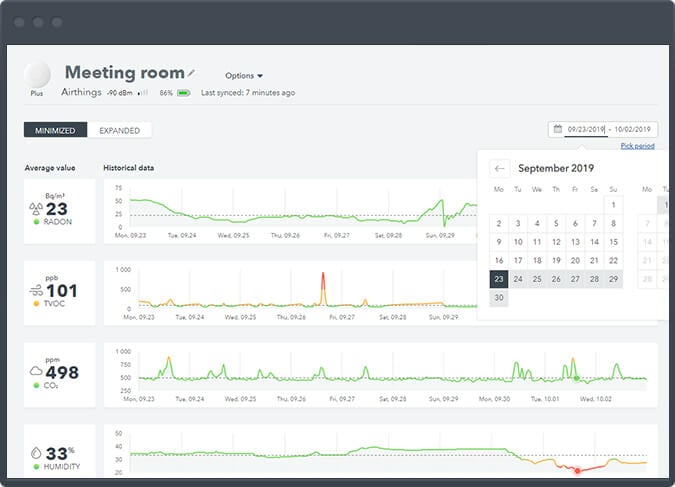
Dig deeper into your data to observe trends, compare current values with past measurements, and identify incidents that correspond with activities.
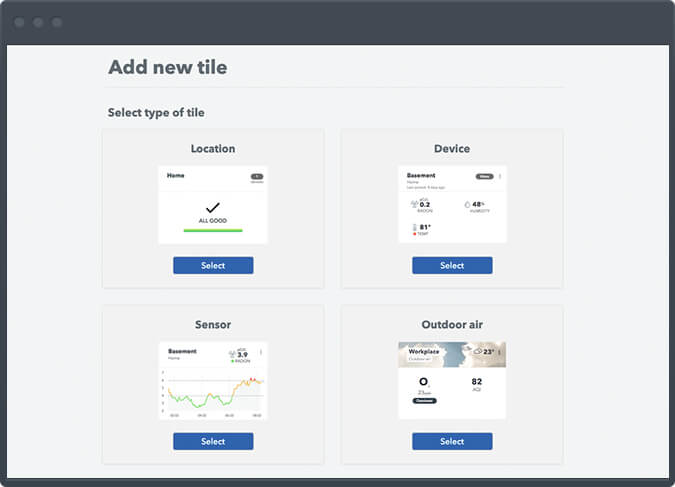
Add and remove tiles to customize your dashboard to your preference. If the account is shared, tailored preferences can also be set per user.
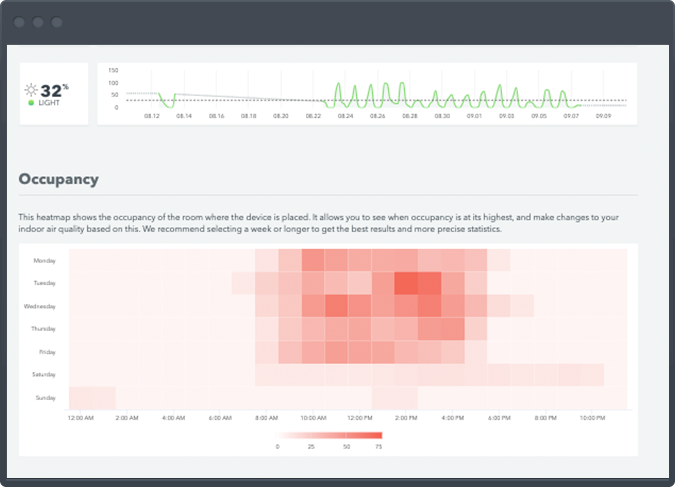
Use occupancy patterns to determine the optimal times for operating your building’s ventilation system, appease indoor climate complaints with live data or confirm when action is needed.
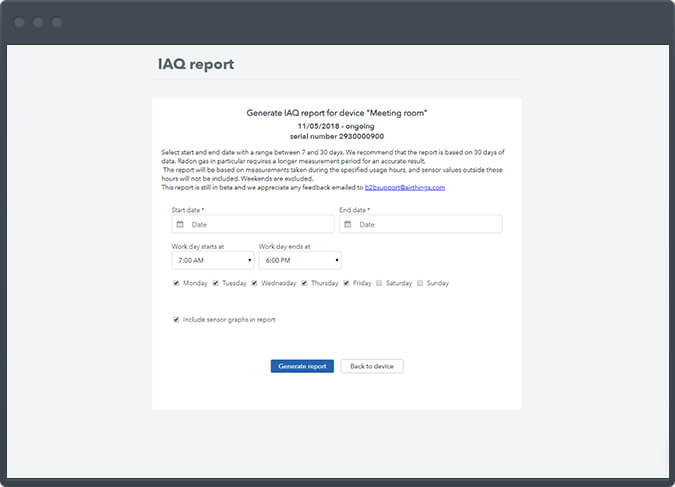
Generate custom radon or IAQ reports to share with your business or export data as a CSV file for further analysis. Ideal if you need to demonstrate proof to enable action.

Get in-depth details of air pollutants from your sensors to identify trends and risks.

Identify usage patterns in line with your IAQ data.

Authorized users within your organization can access your IAQ data.
Login to the Airthings Dashboard using the step-by-step instructions in your onboarding email.
Space Plus for Business is the first smart IAQ monitor with radon detection, designed for all populated spaces. It's the perfect solution for employers and facility managers to gain full visibility into seven indoor air factors; radon, carbon dioxide (CO₂), airborne chemicals (VOCs), humidity, temperature, air pressure, and light. Dive into your sensor data using the online Dashboard with advanced analytics options.
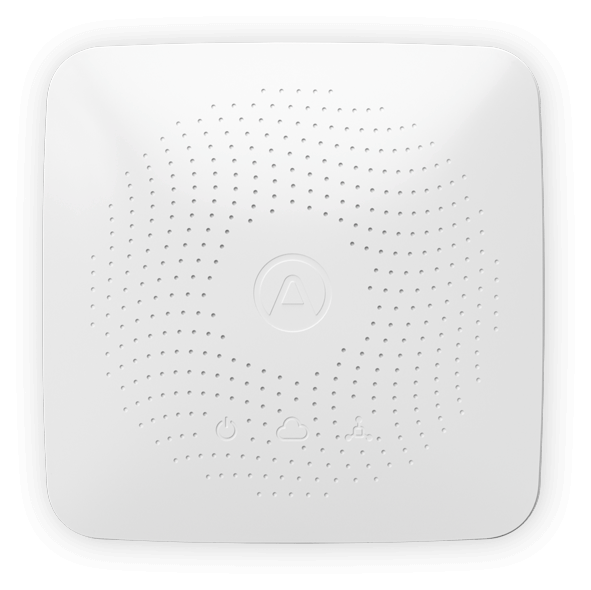
The Space Hub is the heart of your Airthings ecosystem. It brings one or more supported devices online, providing on-demand access to your indoor air quality (IAQ) data at any time, from anywhere. The Hub will connect with Airthings devices with SmartLink, pushing data regularly to your Airthings dashboard. The Hub supports Airthings SmartLink for long-range data extraction. This allows devices to be distributed around a large building and maintain a strong connection.
 Global (English)
 USA (English)
 Canada (English)
 Denmark (English)
 France (Français)
 Germany (Deutsch)
 Italy (Italiano)
 Norway (Norsk)
 Spain (Español)
 Sweden (English)
 UK (English)